White Paper: Coalition Sustainability

White Paper on
SUBSTANCE ABUSE PREVENTION COALITION SUSTAINABILITY
Substance Abuse Prevention coalitions in Tennessee have initiated favorable reductions in adolescent substance abuse over the past decade. Coalition work includes strengthening collaboration among community sectors by working at the grassroots level and utilizing environmental strategies to achieve population-level reductions in youth substance use. Based on the Strategic Prevention Framework model of change, coalitions have proven to utilize funds effectively, producing a benefit: cost ratio of $4.60 in savings in the state of Tennessee.1
Among all coalitions ever funded through the Drug-Free Communities (DFC) program (requiring utilization of environmental strategies to achieve population-level change), rates of substance use have declined significantly across all substances and grade levels
Prevalence of past 30-day use was significantly lower for DFC high school students as compared to a nationally-representative sample2
The work of coalitions implementing comprehensive, multi-faceted strategies to affect youth substance abuse have been proven to be effective in utilizing public funds to reduce youth substance use. Sustainability, however, is integral to the success of maintaining these significant reductions. Coalitions continue to face challenges in securing funding to help their community identify local solutions to address their unique substance abuse challenges.
Shoveling Up the Consequences
A study completed by the National Center on Addiction and Substance Abuse at Columbia University (CASA) finds, “for every dollar the federal and state governments spent on prevention and treatment, they spent $59.83 shoveling up the consequences” of our failure to prevent and treat the problem.
The largest impact on spending to “shovel up” the consequences of substance use “would be to make significant investments in prevention to help avoid the costs altogether.” 3
2ICF International. (2012). Drug free communities support program national evaluation 2011 interim findings report. Retrieved from http://www.whitehouse.gov/sites/default/files/ondcp
/grants-content/2011_dfc_interim_report_final.pdf
3The National Center on Addiction and Substance Abuse at Columbia University (CASA). (2009). Shoveling Up II: The Impact of Substance Abuse on Federal, State, and Local Budgets. National Center on Addiction and Substance Abuse at Columbia University (CASA).
Table of Contents:
I. Background
II. Scope of the Problem
III. Methodology
IV. Cost to Tennessee
V. Effectiveness of Prevention
VI. Prevention Funding Sources in Tennessee
VII. Assumptions
VIII. Limitations
IX. Barriers
X. Cost-Effectiveness of Prevention & Treatment
a. Why coalitions are effective agents of change
b. How substance abuse prevention stacks up against prevention of other chronic diseases
XI. Conclusion
XII. Glossary
XIII. References
XIV. Appendices
a. Appendix I: Reviewed Literature
b. Appendix II: Tables
c. Appendix III: Formulas
d. Appendix IV: About the Authors
Background
Substance abuse and addiction have developed a pervasive and devastating burden on Tennessee. In 2013, public expenditures in Tennessee surpassed three billion dollars on substance abuse and addiction. This figure takes into account only the public burden and does not include individual costs, lost wages, lost productivity or loss of life. This report is the first of its kind, specific to Tennessee; it builds on several national studies that are widely accepted by the field of substance abuse prevention.
Only a small fraction of state and local funding is aimed at preventing substance abuse, while the overwhelming majority of spending goes toward the burden on public programs due to our failure to prevent and treat substance abuse and addiction: these burdens include healthcare spending, Medicaid/Medicare, child welfare, income assistance, employee assistance, housing/homeless assistance, food/nutritional assistance, family assistance, education, mental health, developmental disabilities, public safety (law enforcement), adult corrections, juvenile justice, drug courts and criminal courts.
As the well-executed study Shoveling Up II: The Impact of Substance Abuse on Federal, State and Local Budgets explains, “for every dollar the federal and state governments spent on prevention and treatment, they spent $59.83 shoveling up the consequences” of our failure to prevent and treat the problem. Almost three-fifths of federal and state spending on these issues goes toward healthcare since “untreated addiction causes or contributes to over 70 other diseases requiring hospitalization.”1
Scope of the Problem
While substance abuse prevalence of use data in Tennessee show promising trends between 2011 and 2012, according to the National Survey on Drug Use and Health (NSDUH), trends in prescription drug abuse and abuse among current users continues to climb. While a minor decrease is noted among adolescents, prevalence of 30 day use of nonmedical pain relievers among adults is on the rise. Similarly, binge alcohol use among 12-17 year olds has increased slightly. The two communities observed in this study receive funding to address local conditions at the community-level related to substance abuse, and have, as a result, experienced reductions in 30-day prevalence of use.
Among adolescents in Tennessee:
∙ In the past month 8.46% of 12-17 year olds have used illicit drugs, 10.17% have used alcohol, 6.46% have reported binge alcohol use, 11.47% have used tobacco products, 8.7% have used cigarettes, and 8.7% have used nonmedical pain relievers.2
∙ Of 12-17 year olds 31.5% perceive smoking marijuana once a month as a great risk, 42.52% perceive drinking five or more drinks once or twice a week as a great risk, and 62.54% perceive smoking one or more packs of cigarettes a day as a great risk. 2
Among Tennessee residents aged 18 and older:
∙ In the past month 18.03% of 18-25 year olds have used illicit drugs, 49.74% have used alcohol, 31.57% have reported binge alcohol use, 42.99% have used tobacco products, 34.84% have used cigarettes, and 6.64% have used nonmedical pain relievers. 2
∙ In the past month 5.17% of people age 26 and over have used illicit drugs, 40.93% have used alcohol, 17.21% have reported binge alcohol use, 33.68% have used tobacco products, 28.23% have used cigarettes, and 12.1% have used nonmedical pain relievers.2
∙ Of 18-25 year olds, 19.2% perceive smoking marijuana once a month as a great risk as compared to 38.65% of people age 26 and over. 2
∙ Of 18-25 year olds, 37.76% perceive drinking five or more drinks once or twice a week as a great risk as compared to 43.99% of people age 26 and over. 2
∙ Of 18-25 year olds, 63.07% perceive smoking one or more packs of cigarettes a day as a great risk as compared to 66.85% of people age 26 and over. 2
Decades ago, society positioned substance abuse addiction as a moral weakness. Countless studies, however, have since disproven this notion. Many scientists, spearheaded by Dr. Nora Volkow, Director of the National Institute of Drug Abuse, clearly define addiction as a chronic disease—a brain disease.3Chronic diseases are susceptible to relapse; however, a common expectancy for patients engaged in treatment for addiction is to be treated for a short period of time and be better for the remainder of their lifetime without further intervention. There are many similarities between substance abuse and other chronic medical conditions including diabetes, hypertension and asthma. Each aforementioned chronic disease has both a physiological and behavioral component. Treatment includes individual behavior change. With respect to substance abuse addiction, the behavior is substance use. With respect to diabetes, for example, the behavior includes diet and exercise. In either case, successfully maintaining health is a life-long commitment to that behavior change and medical supervision is necessary over the course of the lifetime. Consider relapse rates among chronic diseases: substance abuse addiction is situated in the middle of relapse rates for diabetes, hypertension and asthma, as illustrated by the data in the chart below, initially published by the Journal of the American Medical Association:

Furthermore, according to Rick Johnson, CEO of the Governor’s Foundation for Health and Wellness of Tennessee, 70 percent of chronic disease is related to behavior; however, less than 10 percent of healthcare expenditures go toward prevention.5
Methodology
For years, Columbia University’s National Center on Addiction and Substance Abuse (CASA) has studied federal and state budgets to assess the impacts of substance abuse and addiction on public spending. Their focus has been on state and federal expenditures (or “burden spending”) related to smoking, underage and excessive drinking, illegal drug use and illegal prescription drug use. The analysis demonstrates that federal, state and local governments spend more than $500 billion per year (in 2014 dollars). Furthermore, “of every dollar federal and state governments spent on substance abuse and addiction in 2005, 95.6 cents went to ‘shoveling up’ the wreckage and only 1.9 cents on prevention and treatment, 0.4 cents on research, 1.4 cents on taxation or regulation and 0.7 cents on interdiction” These figures are based on 2005 spending because that is the most recent information available. However, CASA’s assessment of the situation indicates that “there is nothing to suggest that anything in this area has changed."1
While the CASA analysis provides extremely valuable information on federal and state burden spending, it does not provide cities, counties, and other local jurisdictions information on their share of federal, state and local burden spending. More importantly, there is little information on the benefits derived from local burden spending, which exceeds $100 billion dollars per year. It is the purpose of this report to extend the analysis of the CASA data to provide estimates of the total federal, state and local burden spending that can be reasonably attributed to a particular county or city. A particular focus is on local burden spending and the effectiveness of local programs designed to change the substance abuse and addiction culture and environment. The method is applied to estimate the burden spending and assess the benefits relative to the costs of certain local approaches to two counties in Tennessee. With some care, however, the general approach can be adapted to other counties, towns and cities throughout the country.
For the purpose of this analysis, the term burden spending is defined in the following way:
Burden spending refers to public expenditures on federal, state, and local programs due to the costs of substance abuse and addiction (i.e., healthcare spending, Medicaid/Medicare, child welfare, income assistance, employee assistance, housing/homeless assistance, food/nutritional assistance, family assistance, education, mental health, developmental disabilities, public safety (law enforcement), adult corrections, juvenile justice, drug courts and criminal courts).
It is important to note that calculations in this report are subject to less than 0.03 percent rounding error as dollar values are rounded to the hundredth value. Having a credible estimate of local burden spending is useful in characterizing the nature and extent of the problem and quantifying its impact on local fiscal policy. The benefits and costs of preventing or reducing substance abuse and addiction can be expressed in terms of a reduction of burden spending. This, in turn, can be used as the basis for benefit: cost assessments of prevention efforts from the perspective of public finance. Again, following the lead of CASA1burden spending is defined as “related to smoking, underage and excessive drinking and illegal and prescription drug abuse and addiction. In every case, CASA made the most conservative assumptions about the burden of substance abuse and addiction on government budgets.” 1
For the purpose of estimating local burden spending, the CASA analysis provides some very useful results. The following estimates of the percent of total public spending that can be attributed to substance abuse and addiction are particularly useful: ∙ 9.6% of total federal expenditures1 ∙ 15.7% of total state expenditures1 ∙ 9.0% of total local expenditures1
While federal, state and local budgets can vary considerably from year to year, the proportional allocation to specific categories of expenditure remains fairly stable and can serve as the basis for estimates over time. For the Tennessee project, budgets for counties and municipalities were accessed online using the Tennessee Comptroller of the Treasury website.6 Audits for the correct budget year(s) were identified and total actual expenditures for the budget period were used. Line items were added to calculate the total actual expenditures. Local budget directors and the State Comptroller’s Office were contacted to ensure proper budget figures were utilized.
Combining the information above regarding federal, state and local burden spending with readily available data from other sources yields the following straight-forward calculations: Per-capita Federal Burden Spending: ∙
Total Federal Government Spending (OMB) = $3,777 B ∙
Burden Spending as a Percent of Total Spending (CASA) = 9.6% = 0.096
∙ Estimated Federal Burden Spending
▪ = (Percent of Total Spending)(Total Spending)
▪ = (0.096)($3,777) ▪ = $363 B
∙ U.S. Population (Census Bureau) = 320,000,000 ∙
Estimated Federal Per-Capita Burden Spending
▪ = Federal Burden Spending/Population
▪ = ($363 B)/(320,000,000)
▪ = $1,133.1 Per Person Per Year
Per-capita federal spending, in current 2014 dollars, can then be used to compute estimated federal burden spending in well-defined sub-regions of the United States. This is useful for local governments and has added value for the five states that did not respond to the CASA Analysis of the State Expenditure Report: Fiscal Year 1998.9 For example: ∙
Estimated 2014 population of Tennessee8= 6,500,000
∙ Estimated federal burden expenditures in Tennessee
▪ = (Population)(Estimated Per-Capita Burden Spending)
▪ = (6,500,000)($1,133)
▪ = $7.4 billion Similarly, ∙ 75,129 = estimated population of Anderson County, TN in 201410
∙ 54,181 = estimated population of Roane County, TN in 201410
∙ Estimated federal burden expenditures in Anderson County, TN
▪ = (Population)(Estimated Per-Capita Burden Spending)
▪ = (75,129) ($1,133)
▪ = $85.2 million ∙
Estimated federal burden expenditures in Roane County, TN
▪ = (Population)(Estimated Per-Capita Burden Spending)
▪ = (54,181)($1,133) ▪ = $61.4 million
Burden spending on specific categories of spending can also be computed in total dollars spent as well as spending per-capita.
Federal Per-Capita Burden Spending for Anderson County and Roane County
∙ Per-capita Federal Burden Spending (Calculated Above)
▪ = $1,133 Per Person Per Year ∙ Per-Capita Federal Burden Spending on Health as % of Total Burden Spending
▪ = 71.5% = 0.715 ∙ Per-Capita Federal Burden Spending on Health in Tennessee
▪ = (% of Burden Spending on Health)(Per-Capita Burden Spending)
▪ = (0.715)($1133)
▪ = $810.1 Per Person Per Year on Health
∙ Federal Burden Spending on Health in Anderson County
▪ = (Per-Capita Burden Spending on Health)(Population of County)
▪ = ($810.1)(75,129) ▪ = $60,862,003 = $60.9 million
∙ Federal Burden Spending on Health in Roane County
▪ = (Per-Capita Burden Spending on Health)(Population of County)
▪ = ($810.1)(54,181)
▪ = $43,892,028 = $43.9 million
*Figures subject to rounding errors.
As illustrated in the following tables, this can be repeated for federal, state and local burden spending for various well-defined federal budget categories and for any well-defined region for which current population estimates are available. Tables 1, 2, 3 and 4 show the more detailed results of these computations for Anderson and Roane Counties.
Table 1: Federal, Tennessee, Anderson County and Roane County Total and Per-capita Burden Spending Estimates for 20141,6,7,8,10

Table 2: Estimated Federal, State and Local Burden Spending by Major Budget Category for Anderson County, Tennessee for 20141,6,7,8,10

Table 3: Estimated Federal, State and Local Burden Spending by Budget Category for Roane County, Tennessee1,6,7,8,10

The result is a fairly detailed picture of what substance abuse and addiction cost in terms of public spending from federal, state and local sources. Strategies to reduce substance abuse and addiction will correspondingly reduce related public burden spending and serve as the basis for assessing benefits to the community.
Once local burden spending is calculated, attention focuses on change in burden spending, as a result of prevention (in this instance it is a cost savings, resulting from a reduction in prevalence of use). By utilizing existing survey data, the rate of change was calculated based on baseline and follow-up prevalence of use rates. By utilizing raw data from the National Survey on Drug Use and Health (NSDUH)2for Tennessee (numbers, not percentages), the rate of change was calculated in the following way (data illustrated in Table 4):
Rate of Change in NSDUH Survey Estimates of “30-Day Use”
▪ = ((Post-Survey Estimate - Baseline Estimate)/(Baseline Survey Estimate))(100)
▪ = ((5,977,000 – 6,174,000/6,174,000)(100)
▪ = (-197,000/6,174,000)(100)
▪ = (-0.0412)(100)
▪ = -4.12% = -0.0412 Change in State Burden Spending
▪ = (Rate of Change)(State Burden Spending)
▪ = (-0.0412)($3,023,687,696)
▪ = -$124,504,787.49 Benefit: cost Ratio for State Prevention Spending
▪ = (Change in State Burden Spending)/(Prevention Expenditures)
▪ = (-$124,504,787.49)/($27,064,326.48)
▪ = -$4.60
Table 4: Rate of Change of Substance Abuse in Tennessee

Initially, the team erred on the side of caution, hypothesizing the need to use a high-estimate and a conservative estimate of burden spending due to the gaps in prevalence of use data among adults on the local level. In order to establish these estimates, the reduction rate was calculated for the age cohorts for whom survey data were available. Prior to application of the reduction rate to the local burden spending, the percent of the population represented in the survey population was applied to the local actual budget (ie: Survey data represent 6th through 12th grade students which make up 11 percent of the local population. The local budget was multiplied by 11 percent to establish a relative figure associated with the target age cohort resulting in greatly varied ratios [$18.72 and $2.06, respectively]). When analyzing population level prevalence of use data across the state, however, as measured by the National Survey on Drug Use and Health, the conservative estimate closely matched the high estimate for the 11 percent age cohort, justifying the utilization of adolescent prevalence of use reduction rates in calculating benefit: cost estimates on the population level. One item to note is the rate of change in this study can be identified as cost savings since the rate of change was negative. In some instances, however, the rate of change could be positive, resulting in an increase in burden spending.
Cost to Tennessee
Substance abuse is one of the most costly health problems in Tennessee. In 2013, there were 6.5 million residents in Tennessee: the per capita burden spending as a result of the consequences of substance abuse was $465. At the state level, CASA1estimates burden spending to be 15.7 percent of total spending. Total estimated burden spending in 2013 was $3,023,687,696, based on actual state spending of $19,259,157,300.6 Table 5 illustrates state spending in detail.
Table 5: Federal and Tennessee Total and Per-capita Burden Spending Estimates for 2014

Effectiveness of Prevention
Prevention research continuously indicates that environmental prevention strategies are the most direct and effective way to address community-level substance use and consequences. The Substance Abuse and Mental Health Services Administration (SAMHSA) defines environmental strategies as prevention efforts aimed at changing or influencing community conditions, norms and standards, institutions, structures, systems, and policies that contribute to substance use and its consequences. Complex community health problems, like substance use and abuse require comprehensive, collaborative solutions to achieve benefit for the entire community or targeted population.9This population-level change is the ultimate goal of prevention coalitions.10
Most public health issues are complex, multi-layered problems that require solutions at the community level. Prevention coalitions serve as a means for an individual community to organize, plan and deliver multi-faceted prevention programs, policies and practices. Prevention coalitions are collaborative efforts that create an integral structure and system for organizing and mobilizing communities to assess, direct and coordinate activities for preventing and reducing the impact of substance abuse. Coalitions follow a prevention science model, which is defined as the application of a scientific methodology that seeks to prevent or moderate major human dysfunctions before they occur. The field of prevention science is contributing to a new generation of evidence-based approaches and policies that, if widely utilized, offer the potential of reducing the mortality and morbidity associated with a number of major health and social problems.11
In an environmental prevention model, the focus on addressing substance use and consequences shifts from an individual focus (ie: providing information, building skills, providing support [treatment]) to an environmental (population-level) focus. Environmental prevention strategies are designed to impact every member of a target population by changing the culture and contexts within which decisions are made. These strategies focus on creating system-level change by targeting community risk factors such as laws and norms favorable toward substance use and/or availability of drugs and alcohol.
Some examples of environmental strategies include: ∙ Reducing retail access ∙ Reducing social access ∙ Changing social norms ∙ Restricting promotions ∙ Increasing perceived risk of use ∙ Increasing pricing ∙ Strengthening enforcement ∙ Improving laws, regulations and policies to reduce substance use and its negative consequences
Environmental prevention strategies target a broad audience and produce changes in behavior at the population-level. These strategies create shifts in both individual attitudes and community norms that can have long-term, substantial effects on substance use. In 2010 Community Anti-Drug Coalitions of America (CADCA) published a research and evaluation white paper that provides an overview of the research on the effectiveness of a variety of environmentally-focused strategies to reduce underage drinking, tobacco use and drug use. CADCA found that environmental strategies, as part of a comprehensive prevention effort, are strongly supported by prevention researchers and practitioners and government and nongovernmental agencies and organizations working to prevent substance abuse.12
There is strong scientific evidence to support the effectiveness of environmental strategies as well as evidence that coalitions can be successful at implementing prevention programs and environmental strategies to address local substance abuse problems. Effective interventions to address behavior such as substance use and abuse require a comprehensive approach, seeking change at multiple levels.15 Coalitions are designed to bring stakeholders together to engage in environmental and policy strategies. It has been demonstrated that an environmentally directed approach to prevention, using policies as the form of intervention, does reduce problems at the local level.16 CADCA’s research concludes that, “by ensuring that a multi-level, multi-component response is implemented by the multitude of community stakeholders involved in the coalition, communities are more likely to reduce substance abuse population-wide. Research is clear that both individual level and community-level interventions are needed to affect all individuals and sectors within the community. Coalitions are well poised to be the change agent to help the community select the right combination of evidence based programs, policies and practices to achieve population-level reductions in substance abuse/use rates”.12 An essential component of long-term preservation of any community prevention effort is the development of local resources in support of such interventions. Without local resources, no community prevention effort can become totally sustainable.16
Prevention Funding Sources in Tennessee
Currently, 13 communities are funded through the Drug-Free Communities Support Program through the Office of National Drug Control Policy. Two communities currently receive funding through the STOP Act, a grant focusing on underage drinking prevention, funded through SAMHSA (Substance Abuse and Mental Health Services Administration). In addition, the Tennessee Department of Mental Health and Substance Abuse Services funds 36 coalitions by state grants through funding available through federal block grants for Established and Developing Coalitions. The department also has funding for the Partnership for Success program, funding 19 coalitions through SAMHSA. The Governor’s Highway Safety Office funds a few prevention programs and a small amount of private foundation grants are granted to coalition work also. Of substance abuse prevention and treatment funding in Tennessee, 17 percent is directed toward prevention while 83 percent is directed toward treatment. In 2014, for the first time, monies from the Tobacco Settlement Master Agreement were directed toward prevention, increasing the likelihood of observing behavior change, resulting in a decrease in burden spending.
Assumptions & Key Inclusions
Upon embarking on this project, the team had to make assumptions to allow the project to advance. Assumptions and key inclusions to the study included: ∙ Local municipalities realize a change in burden spending proportional to the rate of change of prevalence of 30-day use, even though cost savings may not appear for several years.17 ∙ The most effective way to evaluate the effectiveness of prevention is to measure prevalence of use. ∙ Allocations across disaggregated cost categories are estimates based on figures provided by the CASA study,1 which are the national states’ average of the 45 participating states. ∙ A comprehensive set of environmental strategies was used on the population-level, implemented by a variety of sectors; based on information currently available, the team was not able to determine the level of attribution of coalition activities since the coalitions do not work in isolation. Many sectors provide some level of prevention in the community.
Limitations
Prevention strategies cannot be easily stratified due to the complexities of their aggregate effect. In addition, there exists a law of diminishing returns. With respect to prevention, the Law of Diminishing Returns refers to the decreased amount of extra output (benefit) that we can get by successively applying equal amounts of varying input (prevention) to fixed amounts of other inputs. The effects occurring as a result of a prevention program may not fit a linear trend, meaning the effect may not appear for several years.18 This analysis is a conservative estimate of spending on substance abuse spending. At each point where a lower figure or higher figure was available, the team used the most conservative figure. It is important to remember this model of analysis has evolved significantly as the project has developed and remains a fluid document, subject to change as new information is uncovered. Finally, state and federal budgets operate on different fiscal years, so 2013 and 2014 dollars tend to be used for federal and state figures, respectively. The analysis only includes public spending and does not take into account private sector or individual spending. Data collection for individual spending is time and cost prohibitive.
Barriers
There were five non-participating states in the national data collection activity conducted on burden spending by the Center on Addiction and Substance Abuse at Columbia University, including Indiana, North Dakota, Rhode Island, Tennessee and Utah. For these states, a method of analysis was developed based on percentages reported in the study findings. Assumptions were made to fill in gaps where prevalence of use data were missing for each age cohort. Since local municipality budgets are often accessible in different places and are organized and prepared differently, they can be difficult to interpret by the untrained eye. Care was taken to consult with proper officials to ensure actual expenditure data were used. Furthermore, what appears to be a local budget is sometimes not reflective of actual expenditures; some local budgets include spending on utilities, which is actually reimbursed by residents. In this case, the utility expense was deducted from calculations of burden spending. Strategies vary by local conditions; therefore, there is not one single evidence-based model to follow. Rather, we follow the coalition model, which is focused on environmental strategies and initiates larger reduction rates. In addition, no clear mathematical equation exists to measure dosage of prevention. Finally, gaps in data exist, especially in census and survey data. Intensive data collection was sometimes necessary and when data were not available, assumptions had to be made.
Cost-Effectiveness of Prevention & Treatment
Prevention and treatment are closely intertwined and together, yield a benefit: cost ratio of $4.60 in savings (ie: -$4.60) in the state of Tennessee. In other words, for every dollar spent on prevention, the state saves $4.60 in burden spending (-$4.60) as a result of substance use. This number differs from local figures since the amount spent on burden costs varies between the state and local municipalities (including healthcare spending, Medicaid/Medicare, child welfare, income assistance, employee assistance, housing/homeless assistance, food/nutritional assistance, family assistance, education, mental health, developmental disabilities, public safety (law enforcement), adult corrections, juvenile justice, drug courts and criminal courts). Sustained treatment is essential to the success in addiction recovery. Similar to other chronic diseases like diabetes, hypertension and asthma, addiction has both physiological and behavioral components.19 Furthermore, relapse rates are similar among people treated for drug addiction and other chronic illnesses. Relapse is common among each; therefore, drug addiction should be treated like any other chronic illness, suggesting sustained treatment is essential to a successful recovery.4
In a study conducted by the Substance Abuse and Mental Health Services Administration (SAMHSA) in 2008, Miller and Hendrie evaluated effectiveness of individual and environmental interventions on population-level behavior change. Estimates provided in their analysis allow us to calculate the benefit: cost ratio of individual interventions and environmental interventions. Based on the figures provided in the SAMHSA report, individual interventions (ie: providing information, building skills, providing support [treatment]) yield a benefit: cost ratio of $14.53 (ie: -$14.53) while environmental interventions yield a benefit: cost ratio of $22.76 (ie: -$22.76). This calculation shows an increased effectiveness of environmental interventions of 44.1 percent.20 According to the National Center on Addiction and Substance Abuse at Columbia University (CASA), the largest impact on spending to “shovel up” the consequences of substance use “would be to make significant investments in prevention to help avoid the costs altogether.” Outcomes from CASA’s 2009 Shoveling Up II report agree with other research findings in favor of environmental strategies by concluding that “prevention strategies should focus on curbing the human and social costs of substance abuse and addiction and co-occurring problems through comprehensive messages and approaches that are provided early and are reinforced in families, schools and communities”.1In addition, an analysis completed by SAMHSA evaluating the costs of substance abuse and its consequences concluded that “communities should consider a comprehensive prevention strategy based on their unique needs and characteristics and use cost-benefit ratios to help guide their decisions”.20 Adding to the effectiveness of prevention is the requirement of staff and/or volunteers to be Certified Prevention Specialists (International Certification & Reciprocity Consortium) in order to receive state funding for prevention. The purpose of certification is to establish and recognize basic standards for professional competence in the prevention field and, and confirm the credibility of the prevention profession with consumers, employers and funders.
Certification as a Prevention Specialist is based on experience and competencies as set by the International Certification & Reciprocity Consortium (IC&RC). All applicants are required to demonstrate their competency defined in the Certified Prevention Specialist Manual and pass the IC&RC written CPS exam administered by the TCB. By requiring each funded coalition to have a Certified Prevention Specialist on board, Tennessee has taken steps to advance the field of prevention as a viable and effective professional discipline to benefit Tennessee communities.
Why coalitions are effective agents of change
Coalitions typically operate by the Strategic Prevention Framework Model, developed by Substance Abuse and Mental Health Services Administration (SAMHSA), to guide coalitions to systematically assess needs based on data, build capacity, develop a strategic plan, implement effective strategies and evaluate efforts aimed toward achieving program sustainability and cultural competence.21 Coalitions funded under the Drug-Free Communities Support Program are encouraged to focus on environmental prevention strategies, rather than individual-level programs or interventions. In reviewing SAMHSA’s Dollars and Cents: A Cost-Benefit Analysis, researchers provide data from a variety of strategies which allowed our team to calculate that utilization of environmental strategies are 44.12 percent more cost beneficial than are individual-level strategies.20
Conclusion
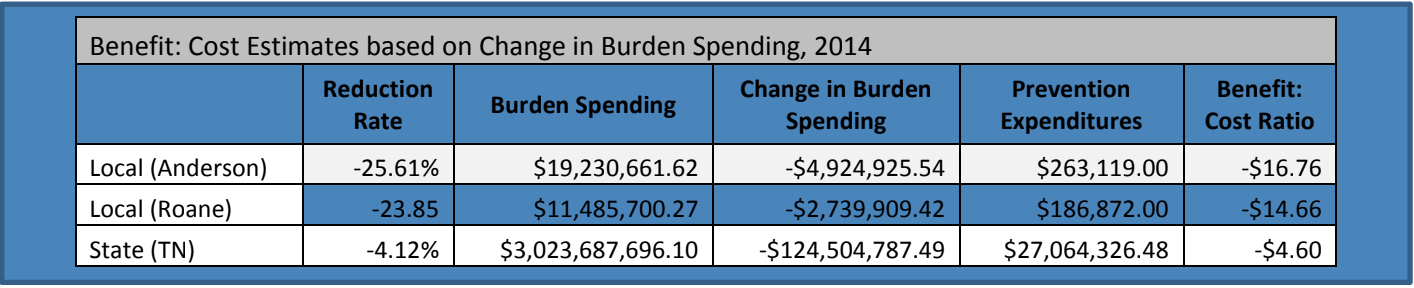
Substance abuse prevention and treatment provides a significant return on investment, saving $4.60 per dollar spent (ie: -$4.60), reducing burden spending. The return on investment for local municipalities is even higher, however. The results of this benefit: cost analysis indicate the return on investment is greater at the local level, as displayed in table 6.24
Table 6: Benefit: Cost Estimates based on Change in Burden Spending, 2014

Federal benefit: cost ratios are difficult to calculate, as one must make a large assumption that prevention expenditures are spent evenly across the country, which they are not. What is known, however, is in communities where prevention spending is targeted, prevalence of use rates are lower.25 The cost of burdens associated with substance use could be reduced by organized, wide-spread implementation of effective environmental prevention strategies. Communities should consider focusing funding on prevention and treatment based on local environmental conditions to realize cost savings, but more importantly to establish a healthy and vibrant community, conducive to raising drug-free children into drug-free adults.
Benefit: cost analyses are critical for long-term survival of coalitions because there is an impending threat to the value of true universal prevention. Coalitions must continue to vie for available funds, to save both money and lives. Using benefit: cost analyses provide empirical, quantifiable evidence of the effectiveness of environmental prevention strategies and are, therefore, imperative to the sustainability of substance abuse prevention coalitions.
Glossary
Addiction- a chronic, potentially relapsing brain disease that is characterized by compulsive drug seeking and use, despite harmful consequences. It is considered a brain disease because drugs change the brain; they change its structure and how it works.
Benefit: Cost Ratio- an indicator, used in the formal discipline of cost-benefit analysis, that attempts to summarize the overall value for money of a project or proposal
Environmental Prevention Strategies- strategies aimed at altering the immediate cultural, social, physical and economic environments in which people make their choices
Law of Diminishing Returns- refers to the decreased amount of extra output (benefit) that we can get by successively applying equal amounts of varying input (prevention) to fixed amounts of other inputs. Prevalence of Use- the degree to which something is prevalent; i.e.: the percentage of a population that is affected with a particular disease at a given time
Prevention- the action of stopping something from happening or arising
Prevention Coalitions- collaborative efforts that create an integral structure and system for organizing and mobilizing communities to assess, direct and coordinate activities for preventing and reducing the impact of substance abuse
Prevention Science- the application of a scientific methodology that seeks to prevent or moderate major human dysfunctions before they occur
Public Burden- money expended by the government that is supported by taxation
Rate of Change- the speed at which a variable changes over a specific period of time. Rate of change can generally be expressed as a ratio between a change in one variable relative to a corresponding change in another
Return on Investment- the benefit resulting in the investment of resources
Strategic Prevention Framework- a 5-step planning process that guides the selection, implementation and evaluation of evidence-based, culturally appropriate, sustainable prevention activities.
References
1 The National Center on Addiction and Substance Abuse at Columbia University (CASA). (2009). Shoveling Up II: The Impact of Substance Abuse on Federal, State, and Local Budgets. National Center on Addiction and Substance Abuse at Columbia University (CASA).
2 Substance Abuse and Mental Health Services Administration, Results from the 2013 National Survey on Drug Use and Health: Summary of National Findings, NSDUH Series H-48, HHS Publication No. (SMA) 14-4863. Rockville, MD: Substance Abuse and Mental Health Services Administration, 2014.
3 Volkow, N. D., & Fowler, J. S., (2000). Addiction, a Disease of Compulsion and Drive: Involvement of the Orbitofrontal Cortex. Cerebral Cortex Special Issue: The Mysterious Orbitofrontal Cortex, 10(3).
4 McLellan A. T., Lewis D. C., O’Brien C. P., & Kleber H.D. (2000). Drug dependence, a chronic medical illness: implications for treatment, insurance, and outcomes evaluation. JAMA: The Journal of the American Medical Association, 284(13), 1689-1695. 5Johnson, R. (2014, November 20). Why the health crisis is a priority for Tennessee. Knoxville Health Forum. Knoxville, TN.
6 Municipal Audit Financial Reports. (n.d.). Retrieved January 8, 2015, from http://www.comptroller.tn.gov/RA_MA_Financial/Default.aspx
7 The President's Budget for Fiscal Year 2015. (n.d.). Retrieved January 8, 2015, from http://www.whitehouse.gov/omb/budget
8 Population Estimates. (n.d.). Retrieved January 8, 2015, from http://www.census.gov/popest/estimates.html
9 The National Center on Addiction and Substance Abuse (CASA) at Columbia University. (2009J). CASA analysis of the state expenditure report: Fiscal year 1998 (Material from Tables 1, A-1, 7, 12, 18, 21, 24, 28, 32, 38,). Washington, DC: National Association of State Budget Officers.
10 Tennessee Subcounty Resident Population Estimates. (n.d.). Retrieved January 8, 2015, from http://cber.bus.utk.edu/census/11subcnty.xls20
11 Evaluating Environmental Change Strategies. (n.d.). Retrieved January 9, 2015, from http://captus.samhsa.gov/access-resources/evaluating-environmental-change-strategies
12 Community Anti-Drug Coalitions of America. (2010). Research Support for Comprehensive Community Interventions to Reduce Youth Alcohol, Tobacco and Drug Use and Abuse [White Paper]. Retrieved from http://www.cadca.org/files/resources/ResearchSupport-4- ComprehensiveInterventions-09-2011.pdf
13 Roussos, S.T. & Fawcett, S.B. (2000). A review of collaborative partnerships as a strategy for improving community health. Annual Review of Public Health, 21, 369-402.
14 Botvin, G. J., & Griffin, K. W. (2005). Prevention science, drug abuse prevention, and life skills training: Comments on the state of the science. Journal of Experimental Criminology, 1(1), 63- 78.
15 Sorensen, G., Emmons, K., Hunt, M. K., & Johnston, D. (1998). Implications of the results of community intervention trials. Annual Review of Public Health, 19, 379-416.
16 Holder, H. D. (2000). Community prevention of alcohol problems. Addictive behaviors, 25(6), 843-859.
17 Pentz, M. A. (1994). Adaptive evaluation strategies for estimating effects of community-based drug abuse prevention programs. Journal of Community Psychology, (Special issue), 26-51.
18 Pentz, M. A. (1998). Costs, benefits, and cost-effectiveness of comprehensive drug abuse prevention. Cost-benefit/cost-effectiveness research of drug abuse prevention: Implications for programming and policy. NIDA Research Monograph, (176), 111-129.
19 The Science of Drug Abuse and Addiction: The Basics. (n.d.). Retrieved January 9, 2015, from http://www.drugabuse.gov/publications/media-guide/science-drug-abuse-addiction-basics
20 Miller, T. R., & Hendrie, D. (2009). Substance abuse prevention dollars and cents: A cost benefit analysis. US Department of Health and Human Services, Substance Abuse and Mental Health Services Administration, Center for Substance Abuse Prevention.
21 Substance Abuse and Mental Health Services Administration (n.d.). Strategic Prevention Framework SPF. Retrieved January 8, 2015, from http://www.samhsa.gov/spf21
22 National Conference of State Legislatures (2013). States address the cost of diabetes: A 50- state budget survey for fiscal year 2013. Retrieved January 9, 2015 from http://www.ncsl.org/portals/1/documents/health/diabetesbudget13.pdf
23 Centers for Disease Control (2011). Diabetes interactive atlas. Retrieved January 8, 2015 from http://www.cdc.gov/diabetes/atlas/countydata/atlas.html
24 Department of Health and Human Services: Substance Abuse and Mental Health Services Administration. (n.d.).Justification of estimates for appropriations committees: Fiscal year 2014. Retrieved January 16, 2015, fromhttp://www.samhsa.gov/sites/default/files/samhsa fy2014-budget_0.pdf
25 ICF International. (2012). Drug free communities support program national evaluation 2011 interim findings report. Retrieved from http://www.whitehouse.gov/sites/default/files/ondcp /grants-content/2011_dfc_interim_report_final.pdf22 Appendix I: Reviewed Literature Caulkins, J. P., Pacula, R. L., Paddock, S. M., & Chiesa, J. (2002). School-based drug prevention: What kind of drug use does it prevent?. Santa Monica, CA: RAND Corporation. Chatterji, P., Werthamer, L., Lillie-Blanton, M., & Caffray, C. (1998). Methods for Investigating Costs and Benefits of Prevention Interventions. Drug Abuse Prevention Through Family Interventions, 401. Frieden, T. R. (2010). A framework for public health action: the health impact pyramid. American journal of public health, 100(4), 590-595. Gentilello, L. M., Ebel, B. E., Wickizer, T. M., Salkever, D. S., & Rivara, F. P. (2005). Alcohol interventions for trauma patients treated in emergency departments and hospitals: a cost benefit analysis. Annals of surgery, 241(4), 541. National Drug Intelligence Center. (2011). The Economic Impact of Illicit Drug Use on American Society. Washington D.C.: United States Department of Justice. Office of Alcohol and Drug Abuse Prevention Division of Behavioral Health Services, Arkansas Department of Health and Human Services. (2010). Substance Abuse Prevention Dollars and Cents in Arkansas: A Cost-Benefit Analysis. Department of Health and Human Services Arkansas. Southwest Prevention Center (2004). Cost-benefit of prevention: Review of research literature. Southwest Prevention Center University of Oklahoma Outreach. Swisher, J. D., Scherer, J., & Yin, R. K. (2004). Cost-benefit estimates in prevention research. Journal of Primary Prevention, 25(2), 137-148. The National Center on Addiction and Substance Abuse at Columbia University (CASA). (2001). Shoveling up: The impact of substance abuse on state budgets. National Center on Addiction and Substance Abuse at Columbia University (CASA). Tobler, N. S., & Stratton, H. H. (1997). Effectiveness of school-based drug prevention programs: A meta-analysis of the research. Journal of Primary Prevention, 18(1), 71-128. Woolf, S. H., Husten, C. G., Lewin, L. S., Marks, J. S., Fielding, J. E., & Sanchez, E. J. (2009). The economic argument for disease prevention: Distinguishing between value and savings. Partnership for Prevention.
23 Appendix II: Tables24
Table 7: PER-CAPITA AND ACTUAL BURDEN SPENDING FOR ANDERSON COUNTY
Federal State Local (AC)
Total Public Spending $3,778,000,000,000 $19,259,157,300 $213,674,018
Burden as Fraction of Total Spending0.096 0.157 0.090
Est. Burden Spending $362,688,000,000 $3,023,687,696 $19,230,662
Population 320,000,000 6,500,000 75,129
Per-capita Burden Spending $1,133 $465 $255.97
Federal State (TN) Local (AC) TotalPer-capita Burden Spending on:
Health Care $810 $131 $59.38 $1,000.95Government Workforce $5 $2 $3.58 $10.44Family Assistance $175 $35 $20.99 $230.89Education $26 $101 $62.71 $189.73Mental Health $17 $29 $0.00 $45.84Public Safety $35 $7 $34.81 $76.46Justice $27 $147 $74.49 $248.69Interdiction $12 $0 $0.00 $12.47Regulation/compliance $0 $0 $0.00 $0.00Prevention, Treatment & Research$26 $14 $0.00 $40.49
Total $1,133 $467 $255.97 $1,855.95
25TABLE 7: CONTINUED Calculate Burden Spending by Budget Category for AC
Health Care $60,883,114 $9,855,537 $4,461,513 $75,200,165Government Workforce $340,605 $174,744 $269,229 $784,578Family Assistance $13,113,286 $2,656,102 $1,576,914 $17,346,303Education $1,958,478 $7,583,871 $4,711,512 $14,253,861Mental Health $1,277,268 $2,166,820 $0 $3,444,088Public Safety $2,639,687 $489,282 $2,615,370 $5,744,339Justice $2,043,629 $11,043,793 $5,596,123 $18,683,545Interdiction $936,663 $0 $0 $936,663Regulation/compliance $0 $0 $0 $0Prevention, Treatment & Research$1,958,478 $1,083,410 $0 $3,041,888
Total $85,151,209 $35,053,559 $19,230,662 $139,435,429(Note: Totals are subject to less than 0.03 percent rounding error.)
26 Table 8: PER-CAPITA AND ACTUAL BURDEN SPENDING FOR ROANE COUNTY
Federal State Local (RC)
Total Public Spending $3,778,000,000,000 $19,259,157,300 $127,618,892
Burden as Fraction of Total Spending0.096 0.157 0.090
Est. Burden Spending $362,688,000,000 $3,023,687,696 $11,485,700
Population 320,000,000 6,500,000 54,181
Per-capita Burden Spending $1,133 $465 $211.99
Federal State (TN) Local (RC) TotalPer-capita Burden Spending on:
Health Care $810 $131 $49.18 $990.74Government Workforce $5 $2 $2.97 $9.83Family Assistance $175 $35 $17.38 $227.28Education $26 $101 $51.94 $178.95Mental Health $17 $29 $0.00 $45.84Public Safety $35 $7 $28.83 $70.48Justice $27 $147 $61.69 $235.89Interdiction $12 $0 $0.00 $12.47Regulation/compliance $0 $0 $0.00 $0.00Prevention, Treatment & Research$26 $14 $0.00 $40.49
Total $1,133 $467 $211.99 $1,811.97
27TABLE 8: CONTINUED Calculate Burden Spending by Budget Category for RC Health Care $43,907,253 $7,107,546 $2,664,682 $53,679,482Government Workforce $245,635 $126,020 $160,800 $532,455Family Assistance $9,456,947 $1,915,509 $941,827 $12,314,283Education $1,412,401 $5,469,282 $2,813,997 $9,695,680Mental Health $921,131 $1,562,652 $0 $2,483,783Public Safety $1,903,671 $352,857 $1,562,055 $3,818,583Justice $1,473,810 $7,964,485 $3,342,339 $12,780,633Interdiction $675,496 $0 $0 $675,496Regulation/compliance $0 $0 $0 $0Prevention, Treatment & Research$1,412,401 $781,326 $0 $2,193,727 Total $61,408,745 $25,279,677 $11,485,700 $98,174,123(Note: Totals are subject to less than 0.03 percent rounding error.)
28 Appendix III: Formulas Summary of Calculations - What follows is a summary of the calculations needed to apply readily available data and widely accepted study results to obtain reasonable estimates of burden spending by federal, state and local governments. Changes in burden spending then serve as the measure of public benefits for benefit: cost analysis. Per-capita Federal Burden Spending: ∙ Total Federal Government Spending (OMB) = $3,777 B ∙ Burden Spending as a Percent of Total Spending (CASA) = 9.6% = 0.096 ∙ Estimated Federal Burden Spending ▪ = (Percent of Total Spending)(Total Spending) ▪ = (0.096)($3,777) ▪ = $363 B ∙ U.S. Population (Census Bureau) = 320,000,000 ∙ Estimated Federal Per-Capita Burden Spending ▪ = Federal Burden Spending/Population ▪ = ($363 B)/(320,000,000) ▪ = $1,133.1 Per Person Per Year Per-Capita Tennessee Burden Spending ▪ Total Federal Burden Spending (State Comptroller) = $19,259,157,300 ▪ Burden Spending as a Percent of Total State Spending (CASA)=15.7%=0.15.7 ▪ Estimated State Burden Spending ▪ = (Percent of Total Spending)(Total State Spending) ▪ = (0.157)($19,259,157,300) ▪ = $3,023,687,696 ▪ Tennessee Population (Census Bureau) = 6,500,000 ▪ Estimated Tennessee Per-Capita Burden Spending ▪ = Tennessee Burden Spending/Population ▪ = ($3,023,687,696)/(6,500,000) ▪ = $465 Per Person Per Year29 Per-Capita Local Burden Spending for Roane County ▪ Total Public Spending in County = $127,618,892 ▪ Burden Spending as Percent of Local Spending (CASA) = 0.09 ▪ Estimated Local Burden Spending ▪ = (Percent of Total Spending)(Total County Spending) ▪ = (0.09)($127,618,892) ▪ = $11,485,700 ▪ County Population = 54,181 ▪ Estimated Per-Capita Local Burden Spending ▪ Local Burden Spending/Population ▪ = $11,485,700/54,181 ▪ = $212.0 Per Person Per Year Per-capita burden spending estimates can be further disaggregated into spending by federal budget category as shown in Appendix Tables 8 and 9. For example, federal burden spending on health care for Roane County can be computed as follows: Federal Per-Capita Burden Spending for Roane County ∙ Per-capita Federal Burden Spending in Roane County (Calculated Above) ▪ = $1,133 Per Person Per Year ∙ Per-Capita Federal Burden Spending on Health as % of Total Burden Spending ▪ = 71.5% = 0.715 ∙ Per-Capita Federal Burden Spending on Health in Roane County ▪ = (% of Burden Spending on Health)(Per-Capita Burden Spending) ▪ = (0.715)($1133) ▪ = $810.1 Per Person Per Year on Health ∙ Federal Burden Spending on Health in Roane County ▪ = (Per-Capita Burden Spending on Health)(Population of County) ▪ = ($810.1)(54,181) ▪ = $43,892,028 Carrying out these calculations for federal, state, and local governments and for specified budget categories (health, workforce, family assistance ….) yields a per-capita matrix of coefficients that can be used to construct a table that provides a complete picture of federal, state and local burden spending by budget category. Initiatives that can be reasonably documented to reduce these burden expenditures can serve as the basis for estimation of public finance benefits and benefit: cost ratios as shown below for the State of Tennessee.30 Rate of Change in NSDUH Survey Estimates of “30-Day Use” ▪ = ((Post-Survey Estimate - Baseline Estimate)/(Baseline Survey Estimate))(100) ▪ = ((5,977,000 – 6,174,000/6,174,000)(100) ▪ = (-197,000/6,174,000)(100) ▪ = (-0.0412)(100) ▪ = -4.12% = -0.0412 Change in State Burden Spending ▪ = (Rate of Change)(State Burden Spending) ▪ = (-0.0412)($3,023,687,696) ▪ = -$124,504,787.49 Benefit: cost Ratio for State Prevention Spending ▪ = (Change in State Burden Spending)/(Prevention Budget) ▪ = (-$124,504,787.49)/($27,064,326.48) ▪ = -$4.6031
Appendix IV: About the Authors Stephanie A. Strutner, MPH, CPSII is the Executive Director of Allies for Substance Abuse Prevention of Anderson County, Inc. As a former epidemiologist and current evaluator, Ms. Strutner has worked with substance abuse prevention coalitions since 2005 and has a wealth of knowledge on evaluation, performance measures, and outcomes with a focus on legislative advocacy, and embodies the mission of ASAP. No conflicts of interest identified. Sarah Harrison, MS, CPSII is the Executive Director of the Roane County Anti-Drug Coalition and has been in this role since 2007. Ms. Harrison has managed the coalition’s development from a grassroots organization to an established community asset. Under Ms. Harrison’s leadership, Roane County, Tennessee has adopted a comprehensive substance abuse continuum combining policies and practices to reduce substance use through prevention; outpatient and residential treatment; ongoing recovery support services; and community-based relapse prevention. No conflicts of interest identified. Wayne Stevenson, PhD served until his retirement in 2012 as Vice President of Oak Ridge Associated Universities (ORAU), a consortium of more than 100 major research universities that has responsibility for the management and operation of $500 million per year in federal programs that focus on science education, national security and public health. He currently serves as President of the American Museum of Science and Energy Foundation. Dr. Stevenson holds a Ph.D. in Economics from the University of Minnesota and has held faculty positions at The University of Utah, The State University of New York and Middlebury College. He has testified before Congress and the U.S. Secretary of Energy Advisory Board. He has authored or coauthored several books on analysis and evaluation as well as papers and reports that assess the impacts of federal scholarship, fellowship, internship and workforce development programs. No conflicts of interest identified. Stacey Pratt is the project coordinator for Allies for Substance Abuse Prevention of Anderson County, Inc. where she is responsible for implementing environmental strategies, community outreach and monitoring policy related to prescription drug abuse and underage tobacco and alcohol use. Ms. Pratt is currently pursuing a Master of Business Administration degree and is in the process of completing her CPSII certification. No conflicts of interest identified.